by learnformula
search
For Business
Team license & compliance management
For Higher Education
Academic partnerships
For Government Agencies
Government training solutions
For Instructors & Course Creators
Teach on our marketplace
Become a Sponsor
Reach professionals where they learn
Log inStart 7-Day Free TrialStart Free TrialStart Free Trial
search
  1. Courses
  2. /Office Productivity
  3. /Data Analysis & Visualization

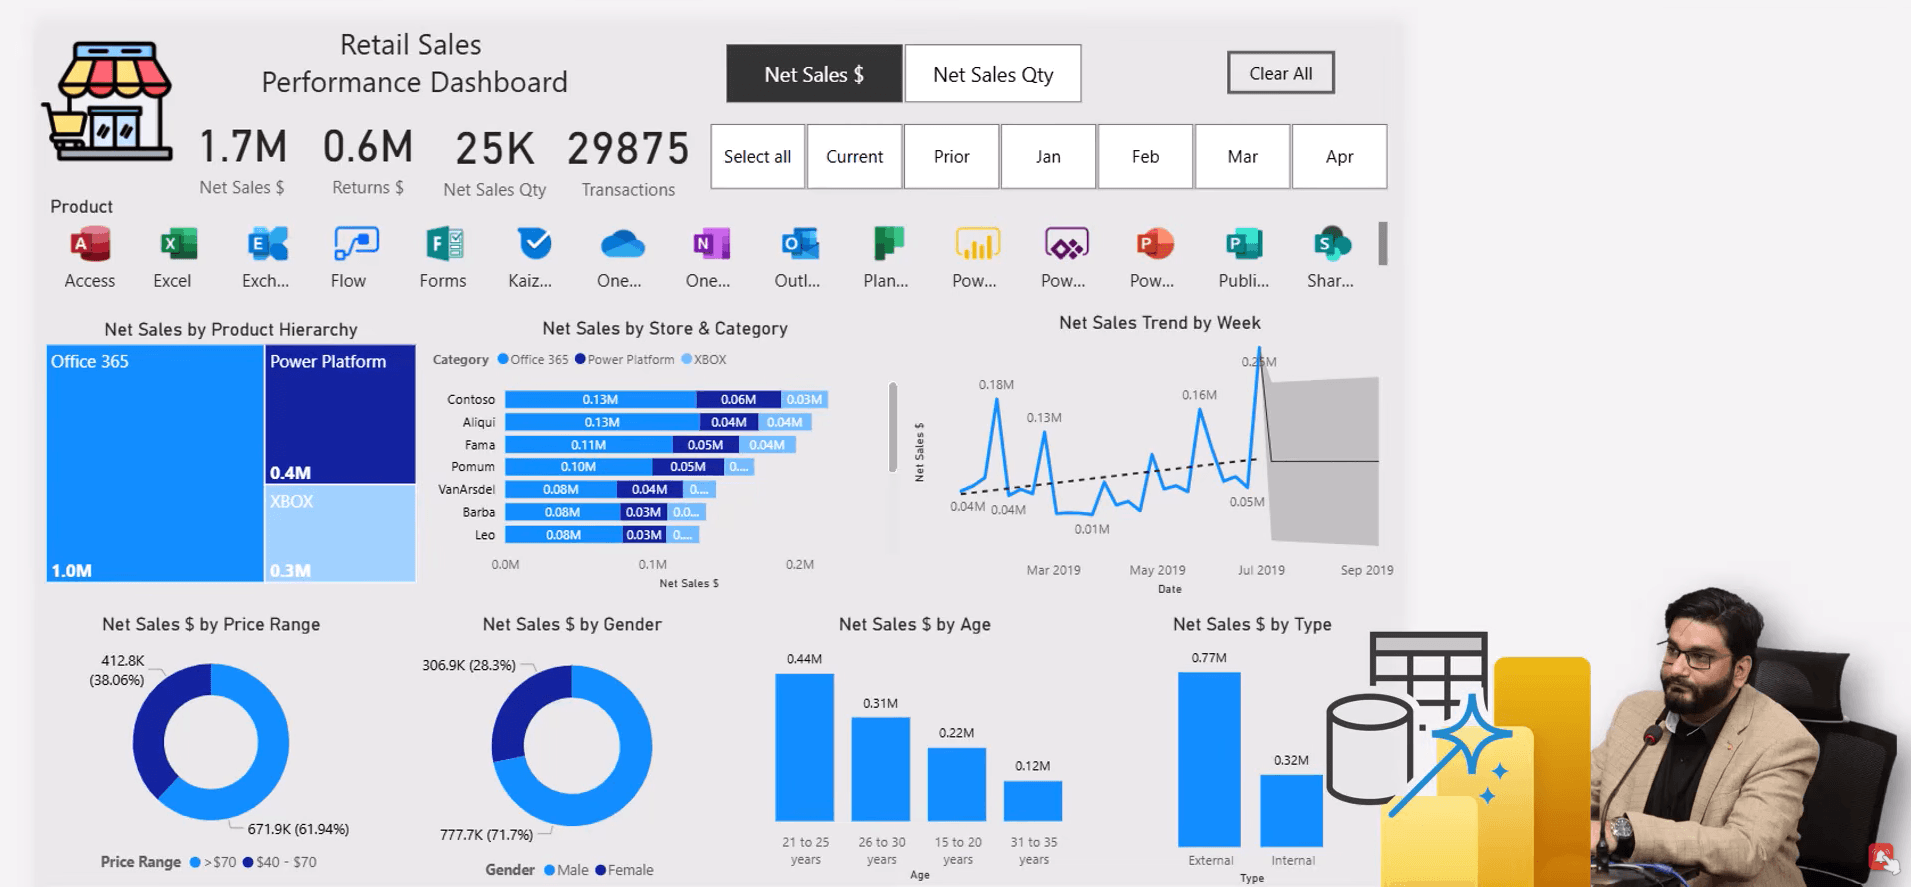
POWER BI End To End Project - Retail Sales Performance Dashboard

Master end-to-end data modeling, DAX measures, and interactive reporting for retail analytics.
Created byRahim Zulfiqar Ali
All LevelsUpdated Oct 22, 2026
POWER BI End To End Project - Retail Sales Performance Dashboard

What You'll Learn

  • check_circleConstruct a star schema model by identifying fact and dimension tables
  • check_circleApply M language in Power Query to create custom date-based labels
  • check_circleDevelop explicit DAX measures for net sales, returns, and transaction counts
  • check_circleImplement field parameters to enable dynamic metric switching in reports
  • check_circleDesign interactive dashboards using bookmarks and button slicers

About This Course

This course provides a comprehensive guide to building a retail sales performance dashboard using Microsoft Power BI. It covers the entire workflow from importing raw Excel data and performing ETL processes in Power Query to establishing a robust star schema data model. Participants will learn to create explicit DAX measures for key performance indicators, implement field parameters for dynamic reporting, and design an interactive user interface with slicers, bookmarks, and custom visualizations. The course emphasizes best practices for filter flow, context management, and professional dashboard layout to effectively communicate retail metrics.

Topics Covered:

  • Power Query data transformation and ETL
  • Star schema data modeling and relationships
  • DAX measures for sales performance metrics
  • Field parameters for dynamic visual switching
  • Time intelligence and custom calendar logic
  • Interactive dashboard layout and formatting
  • Bookmark navigation and filter management

Your Instructor

Rahim Zulfiqar Ali

Data, BI & AI Transformation Leader & Consultant | Founder & CEO - Excel Basement | MVP & MCT

menu_book3 courses
star1 reviews

Data, BI & AI Transformation Leader & Consultant | Founder & CEO - Excel Basement | 2X Microsoft MVP (Excel) | 9X MCT (2016-2025) | PowerBI, Excel, Fabric, Python, SQL

Credit Information

What Students Are Saying

0.0 out of 5
Student's Choice
0 reviews

Frequently Asked Questions

We are a registered provider with 300+ associations and regulatory bodies worldwide. We operate across 27 global markets including Canada, the US, Australia, and the UK. Every course page clearly displays its specific accreditations. Upon completion, you receive a professional certificate that can be validated online. Our certificates include all necessary accreditation details, credit hours, and completion dates, and are formatted specifically to meet the submission requirements of most global regulatory bodies.

You May Also Like

  • Law: Technology Training

    The Lawyer’s Guide to ChatGPT, Claude, Gemini & Copilot

    starRated4.9out of 5,(39 reviews)
    1 CPD hr
  • Law: Technology Training

    AI in Your Law Firm: What Works, What Doesn’t, and Why

    starRated4.9out of 5,(35 reviews)
    1 CPD hr
  • Law: Technology Training

    Microsoft Copilot for Lawyers (2026 Edition)

    starRated5.0out of 5,(26 reviews)
    1 CPD hr